Prevalence of diabetes mellitus in aboriginal and nonaboriginal people living in the Bella Coola Valley
Issue: BCMJ,
vol. 47 , No. 8 , October 2005 ,
Pages 429-437 Clinical Articles
Background: Type 2 diabetes mellitus affects an estimated 4.8% of the Canadian adult population. Diabetes prevalence rates for British Columbia’s aboriginal people have been reported as being lower than those reported for other aboriginal groups, and lower than the overall Canadian rate. The purpose of this study was to determine the prevalence rate of diabetes among the aboriginal and nonaboriginal populations living in the Bella Coola Valley. The relationships between age, gender, weight, body mass index and aboriginal status and having diabetes mellitus were also examined.
Methods: Retrospective population-based medical chart review was conducted using the charts of people living in the Bella Coola Valley and having a chart at the Bella Coola Medical Clinic as of September 2001.
Results: After adjustments were made for age, the data revealed the prevalence of type 2 diabetes among aboriginals to be 12.5%. Among nonaboriginals, the prevalence rate was similar to that reported for the general population of Canada (4.8%). It was determined that age, weight, body mass index, and aboriginal status were all significant contributors to the risk of developing type 2 diabetes.
Conclusion: Given the wide variation in prevalence rates observed and reported for aboriginal people residing in British Columbia to date, the findings in this report indicate the need for individual study of different First Nations groups.
A retrospective population-based medical chart review found that age, weight, body mass index, and aboriginal ancestry all appear to contribute to the risk of developing type 2 diabetes.
According to a report issued by Health Canada in 2002, 4.8% of Canadians, 20 years of age and older, had type 2 diabetes mellitus in 1998–1999.[1] In British Columbia, the prevalence rate is approximately 4.9%.[2] There is considerable agreement among those who study diabetes that the prevalence of the disease is on the rise and will continue to rise if left unchecked. In the United States, the age-adjusted prevalence rate of diabetes has almost doubled in 20 years, going from 2.8% in 1980 to 4.5% in 2000.[3] In British Columbia, it is estimated that the prevalence of diabetes will reach 7.1% by the year 2010.[2]
Aboriginal people as a group appear to be at increased risk of developing adult-onset diabetes mellitus. According to a report published by Health Canada, the prevalence rate of diabetes among the First Nations people in Canada is more than double the rate for the general population.[4] While the prevalence rate of diabetes is higher in the aboriginal population overall, it is important to note that there is considerable regional variation.[5-13] A study conducted by Young and colleagues showed that the prevalence rates of diabetes in aboriginal populations varied greatly among the provinces and territories, with the Atlantic provinces and Ontario having the highest rates, at 8.7% and 7.6%, respectively, while British Columbia, Yukon, and Northwest Territories had the lowest, at 1.6%, 1.2%, and 0.8%, respectively.[8]
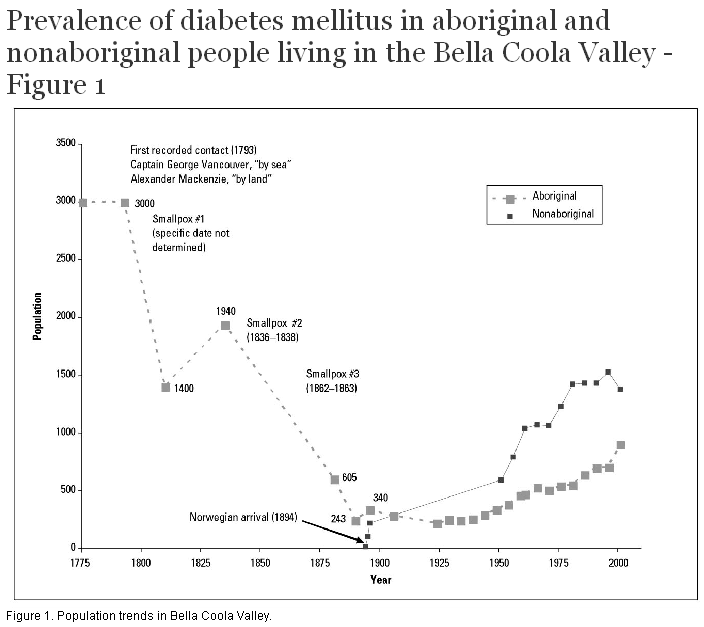
The majority of the studies conducted in Canada on the prevalence of non-insulin-dependent diabetes mellitus have been conducted in eastern Canada, despite the fact that the majority of First Nations tribes live in western Canada. Bella Coola Valley is a rural and remote community located in the central coast region of British Columbia. According to the 2001 census, 2260 people live in the Bella Coola Valley.[14,15] Bella Coola Valley is part of the traditional territory of the Nuxalk Nation. The Nuxalk people are a tribe of Salish-speaking coastal Indians who now live in the Bella Coola Valley, but formerly lived throughout the surrounding British Columbia central coast area.[16-20] Like most aboriginal tribes living in North America, the Nuxalk were affected by smallpox and other diseases during the 1800s and early 1900s (Figure 1).[16,19] According to census information, 44% of Bella Coola’s population is of aboriginal ancestry, most of this group being of Nuxalk descent.[14,15] The majority of these aboriginal people live on the Bella Coola Indian Reserve.
The purpose of this study was to determine (1) the prevalence of diabetes mellitus in both the aboriginal and nonaboriginal populations of Bella Coola, and (2) the relative importance of age, weight, body mass index, and aboriginal ancestry as risk factors for the development of diabetes in this isolated rural population.
We hypothesized that the prevalence of non-insulin-dependent diabetes mellitus would be higher in the aboriginal population than the nonaboriginal population. We also hypothesized that age and weight would be risk factors for the development of diabetes mellitus in this population.
The United Church Health Services operates a clinic and a hospital in Bella Coola at the same site. There are no other primary care health facilities in the area.[20] Bella Coola Hospital is one of the most isolated health care facilities in British Columbia.[21-23] The closest higher-level hospital is over 6 hours away by road in Williams Lake or 2 hours away by air in Vancouver. The isolation of this community is such that almost everyone who lives in the Bella Coola Valley has either a clinic chart or an emergency room record.
This research project was carried out in a participatory fashion, following the recommendations outlined in a recently published policy statement.[24-28] Prior to collecting data, we obtained letters of support from the Nuxalk Band Council, from the Bella Coola Transitional Health Authority, and from the Central Coast Regional District for a comprehensive study on determinants of health for people living in the Bella Coola Valley. Ethics approval was obtained from research ethics committees at both the University of British Columbia and the University of Northern British Columbia. The results and the manuscript were reviewed and approved for publication by both Nuxalk health professionals and United Church Health Services health professionals.
A retrospective review of all clinic charts was conducted. After excluding clinic charts of people who did not currently live within the Bella Coola Valley, 2377 patients made up the study population—approximately 105% of the May 2001 census estimate (2260) for the valley. According to staff working at the Population Section of BC Stats, Canada Census data typically underreport the true population of a community by approximately 5% because people who are not home or in transition during the time of the census are missed. For this reason we are confident that we captured the entire Bella Coola Valley population for this study. Information collected during the chart review included the subject’s address, age, sex, weight, body mass index, aboriginal status, and presence or absence of diabetes.
The presence of diabetes was based on a physician’s diagnosis of diabetes, which in turn was based on the 1998 clinical practice guidelines for the management of diabetes in Canada.[29,30]
The calculation for body mass index (BMI) used was:
| BMI = | Weight (kg) Height2 (m2) |
Aboriginal status[31] for each clinic patient was determined using multiple sources: Nuxalk Band lists, a locally available genealogy, clinic chart, and a recent survey.[32,33] It was found that 47% of the people living in the Bella Coola Valley are of aboriginal descent, which is similar to the census estimate of 44%.[14,15]
Data analysis was performed using SPSS software. The crude prevalence rates of diabetes were calculated through simple frequency tables. The age-adjusted prevalence rates were calculated using the direct method of adjustment, with the standard population being a distribution of the aboriginal and nonaboriginal population combined.[34] For the analysis of statistical significance, the dependent variable is diabetic status as a dichotomous variable. The difference in prevalence rates based on gender and aboriginal status were evaluated using Pearson’s chi-square. The differences based on age, weight, and body mass index, all continuous variables, were evaluated using analysis of variance (ANOVA). Odds ratios were calculated using logistic regression to determine the predictive power of age, weight, and body mass index. For all of the analyses, significance was set at P ≤0.05.[35] All analyses were conducted on the total adult study population (≥18 years), and for aboriginals and nonaboriginals separately, where appropriate.
The characteristics of the study population, which is divided into aboriginal and nonaboriginal subsets, are summarized in Table 1. There is a similar gender distribution in both the aboriginal and nonaboriginal populations, with both populations having a nearly 1:1 ratio of males to females. The nonaboriginal population is substantially older than the aboriginal population, with mean ages of 40.28 ± 21.00 years and 29.09 ± 19.51 years, respectively. The nonaboriginal population also has a higher mean weight than the aboriginal population (70.87 ± 26.31 kg versus 65.77 ± 30.45 kg), but a lower mean body mass index (25.92 ± 6.33 kg/m2 versus 27.25 ± 8.02 kg/m2).
Table 2 shows the proportion of Bella Coola Valley patients with a recent blood glucose measurement in their charts. The data are broken down by age and ethnicity. As one would predict, older patients are much more likely to have glucose values in their charts than younger patients.
Table 3 shows the overall crude prevalence of type 2 diabetes was higher in the aboriginal adult population than in the nonaboriginal adult population (10% versus 6%). Given the differences in the age distributions of the aboriginal and nonaboriginal populations, and the important role that age plays in the prevalence of diabetes, it was important to calculate the age-adjusted prevalence rates for each of the populations. The age-adjusted prevalence rates of diabetes for the aboriginal and nonaboriginal populations were 12.5% and 4.8%, respectively. The relationship between aboriginal ancestry and diabetic status was found to be statistically significant (χ2 = 10.183; P = 0.001).
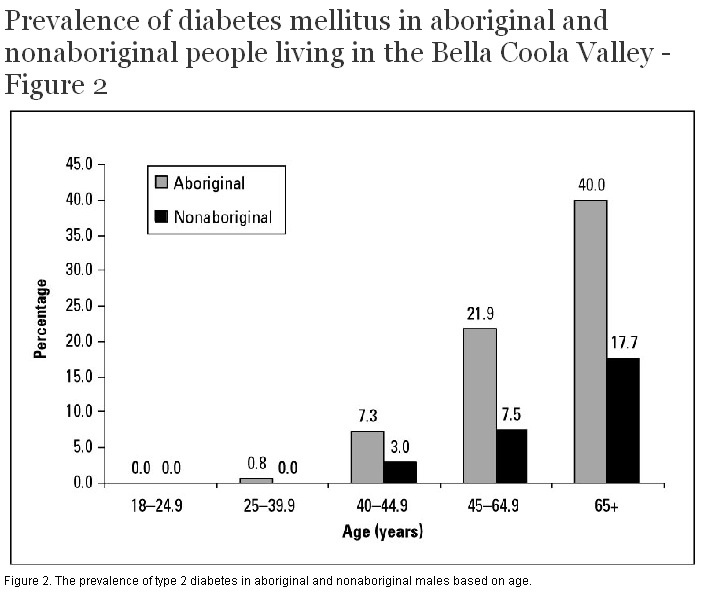
There was no significant relationship found between gender and diabetic status. There was, however, a significant relationship observed between age and diabetic status in both the aboriginal (F = 25.98; P < 0.001) and nonaboriginal populations (F = 13.41; P < 0.001) for both males and females, as shown in Figure 2 and Figure 3.
Weight was also found to be significantly related to diabetic status (aboriginal: F = 7.70; P < 0.001, nonaboriginal: F = 6.34; P < 0.001). As seen in Table 3, the prevalence rate of diabetes generally increases with increasing weight. With the exception of the 70 kg to 79 kg weight category, the aboriginal population had a higher prevalence rate of type 2 diabetes based on weight, with the difference being most apparent in the greater than 110 kg weight category (31% versus 20%).
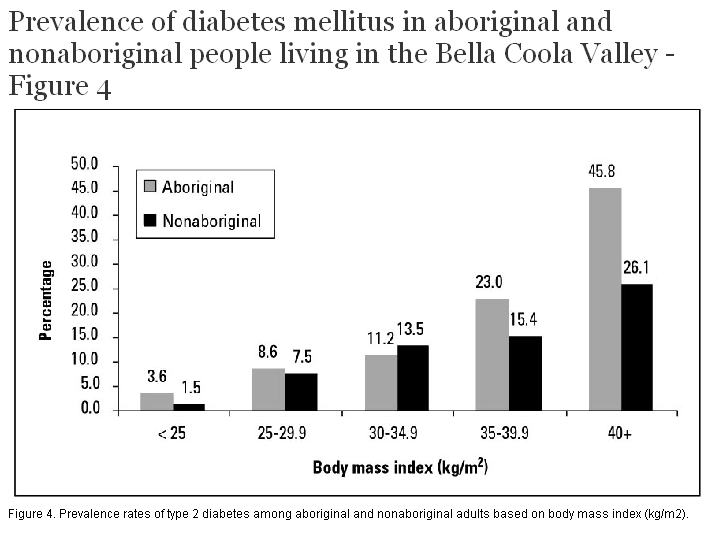
Figure 4 illustrates the distribution of prevalence rates of type 2 diabetes in both the aboriginal and nonaboriginal populations based on body mass index. In both the aboriginal and nonaboriginal populations, the prevalence of diabetes increases with higher body mass index values. The rate of increase seen is more substantial in the aboriginal population than the nonaboriginal population, with the prevalence rate approximately doubling with each higher body mass index category. The increase seen in the nonaboriginal population is more gradual. Despite these slightly different trends, body mass index is significantly related to diabetic status for both populations (aboriginal: F = 15.3; P < 0.001, nonaboriginal: F = 8.02; P < 0.001).
The age-adjusted prevalence rate of diabetes among the aboriginal people in Bella Coola is substantially higher than rates previously reported for First Nations groups in British Columbia.[8-10] In the Bella Coola Valley, the crude prevalence of diabetes in the aboriginal population is more than one and a half times that of the nonaboriginal population (10% versus 6%). However, when the differences in the age distribution of the aboriginal and nonaboriginal populations are considered, and the prevalence rates are adjusted, the prevalence of diabetes in the aboriginal population is more than two and a half times that of the nonaboriginal population (12.5% versus 4.8%). The age-adjusted prevalence rate of diabetes for the nonaboriginal population is the same as that reported for the general population of Canada.[1] The finding of a younger age of diabetes onset for aboriginals has been observed in other studies of diabetes and aboriginal populations.[5,11,36]
Since the Bella Coola Valley study population included both aboriginal and nonaboriginal people, it was possible to compare the two groups in terms of their prevalence of diabetes and the relative importance of known risk factors—age, sex, weight, and ethnicity. To the best of our knowledge, this is something that has not been done explicitly before. Two Canadian studies were found that compared aboriginal people to nonaboriginal people with regard to the prevalence of diabetes.[6,7] While both of these studies compared the prevalence rates of diabetes, and other demographic and risk factor variables, neither study specifically examined the relationship between aboriginal ancestry and diabetic status looking for statistical significance. In the Bella Coola Valley study, chi-squared analysis was used to investigate the relationship between aboriginal ancestry and diabetic status. It was determined through this analysis that there is indeed a significant relationship between aboriginal ancestry and diabetic status (χ2 = 10.183; P = 0.001).
Since both weight and body mass index values were available for analysis in this study, the relationship between both of these factors and diabetic status was also explored. There was a general trend observed, in both the aboriginal and nonaboriginal populations, of increasing weight and prevalence of diabetes. Analysis of variance revealed that, overall, weight was significantly related to diabetic status in both the aboriginal and nonaboriginal populations. Logistic regression analysis indicated specifically that weight greater than or equal to 70 kg was significantly related to an increased risk of diabetes. The risk of developing diabetes increases substantially with increasing weight, especially at a weight of 110 kg or more (OR = 27.5; 95% CI, 6.4–117.1). In this study, using a body mass index of less than 25 kg/m2 as the reference, the odds ratios ranged from 4.0 (95% CI, 1.6–9.7) in the 25 to 29.9 kg/m2 category to 28.1 (95% CI, 11.9–77.6) in the greater than or equal to 40 kg/m2 category. The results are similar to that reported in a study of the Ojibwa-Cree, where the diabetes odds ratio for a body mass index greater than or equal to 26 kg/m2 was 4.51 (95% CI, 1.46–6.74) when compared to a body mass index of less than 26 kg/m2.[37]
Our data suffer from limitations inherent in collecting medical chart information—incomplete information and nonstandardized measurements are common. The sample population was drawn from patients who had been screened for non-insulin-dependent diabetes mellitus. Though there has been a push to screen all adults in this community for non-insulin-dependent diabetes mellitus, this has not been successfully completed yet and the sampling method may therefore have slightly inflated the prevalence rates seen (Table 2). After we initiated our chart review in 2001, new clinical practice guidelines for diabetes management in Canada were published. Fortunately, a comparison of the 1998 and 2003 diabetes guidelines reveals identical definitions of diabetes, classifications of diabetes, and plasma glucose values used to diagnose diabetes. The 2003 clinical practice guidelines advocate the age for routine diabetes screening be lowered from 45 years to 40 years, and routine screening is now indicated for people with other kinds of risk factors (e.g., acanthosis nigricans, vascular disease, polycystic ovary syndrome, and schizophrenia). Screening more adults between age 40 and 45 and finding more people with diabetes would not have substantially changed our basic conclusions.
The reported prevalence rates of diabetes in British Columbia for aboriginal people are low when compared with rates for other aboriginal groups across Canada, and even lower than the prevalence rate reported for the general population of Canada.[17-19] Our study reveals that at least one First Nations group living in British Columbia—the Nuxalk living in Bella Coola—has diabetes prevalence rates comparable to those reported in eastern Canada. Such findings illustrate the need for individual study of different aboriginal groups. For the purposes of community-level planning for programs and health care resources, province-wide surveys do not provide an accurate picture of the problem of diabetes in aboriginal communities in British Columbia.
We would like to acknowledge Mr Bill Tallio, Director, Nuxalk Wellness Program, and Dr R. McIlwain, Former Director, United Church Health Services, for their support of this project. Dr Thommasen would like to acknowledge the Community-Based Clinician-Investigator Program for financial support. The United Church Health Services contributed $2000 to this project, and UNBC provided $5000 research seed money for this project.
Competing interests
None declared.
Table 1. Characteristics of study population.
| Characteristic | Aboriginal (%) | Nonaboriginal (%) |
| Gender Male Female |
566 (50.5) 554 (49.5) |
658 (52.3) 599 (47.7) |
| Age (years) 18-24.9 25-39.9 40-44.9 45-64.9 ≥ 65.0 |
140 (19.5) 254 (35.3) 72 (10.0) 195 (27.1) 58 (8.1) |
92 (9.1) 247 (24.6) 113 (11.2) 394 (39.2) 160 (15.9) |
| Weight (kg)* < 60 60-69 70-79 80-89 90-99 100-09 ≥ 110 |
400 (35.7) 133 (11.9) 157 (14.0) 159 (14.2) 102 (9.1) 64 (5.7) 58 (5.2) |
300 (23.9) 197 (15.7) 209 (16.6) 189 (15.0) 122 (9.7) 75 (6.0) 57 (4.5) |
| Body mass index (kg/m2)† < 25.0 25-29.9 30-34.9 35-39.9 ≥ 40.0 |
287 (25.6) 165 (14.7) 118 (10.5) 94 (8.4) 48 (4.3) |
351 (27.9) 262 (20.8) 127 (10.1) 53 (4.2) 25 (2.0) |
* Weight data is missing for 155 (6.5%) of patients (47 [4.2%] aboriginal; 108 [8.6%] nonaboriginal).
† Body mass index data is missing for 847 (35.6%) of patients (408 [36.4%] aboriginal; 439 [34.9%] nonaboriginal).
Table 2. Charts with glucose screening results.
| Age and ethnicity of chart subject | Total charts reviewed | Percentage with glucose measurement | Percentage of charts with glucose measurement that also include fasting glucose measurement |
| < 18 years Aboriginal Nonaboriginal 18–29.99 years 30–44.99 years 45–64.99 years 65+ years |
401 251
224
242
195
58 |
18.2% (n = 73) 10.8% (n = 27)
45.5% (n = 102)
64.0% (n = 155)
77.9% (n = 152)
96.6% (n = 56) |
24.7% (n = 18) 37.0% (n = 10)
47.1% (n = 48)
68.4% (n = 106)
81.6% (n = 124)
87.5% (n = 49) |
| Total aboriginal Total nonaboriginal Bella Coola Valley |
1120 1258 2378 |
48.0% (n = 538) 50.4% (n = 634) 49.3% (n = 1172) |
64.1% (n = 345) 76.7% (n = 486) 70.9% (n = 831) |
| Adult aboriginal Adult nonaboriginal Adult Bella Coola Valley |
719 1007 1726 |
64.7% (n = 465) 60.3% (n = 607) 62.1% (n = 1072) |
70.3% (n = 327) 78.4% (n = 476) 74.9% (n = 803) |
Table 3. Diabetes and demographic variables.
| Characteristic | Adults N = 1725 | Diabetics n = 127 (7%) | Test value | P value |
| Gender Female Male |
841 884 |
58 (7%) 69 (8%) |
0.552 |
0.470 |
| Aboriginal Nonaboriginal |
719 1006 |
70 (10%) 57 (6%) |
10.231 | 0.001 |
| Age (years) 18-24.9 25-44.9 45-64.9 ≥ 65.0 |
232 686 589 218 |
0 (0%) 15 (2%) 68 (12%) 44 (20%) |
reference 601.328 3534.899 6822.426 |
0.553 |
| Weight (kg) < 60 60-69 70-79 80-89 90-99 100-109 110-160 |
163 283 345 334 220 137 113 |
2 (1%) 6 (2%) 21 (6%) 26 (8%) 26 (12%) 17 (12%) 29 (26%) |
reference 2.017 5.171 7.087 10.087 13.323 28.139 |
0.383 |
| Body mass index (kg/m2) < 25.0 25-29.9 30-34.9 35-39.9 40-59 |
286 392 233 139 71 |
6 (2%) 31 (8%) 29 (12%) 28 (20%) 28 (39%) |
reference 3.957 6.255 13.932 28.333 |
0.010 |
References
1. Health Canada. Diabetes in Canada. 2nd ed. Ottawa: Centre for Chronic Disease Prevention and Control, Population and Public Health Branch; 2002. Full Text
2. Diabetes Working Group. Improving Chronic Disease Management: A Compelling Business Case for Diabetes. Victoria: Government of British Columbia; 2002. Full Text
3. National Center for Chronic Disease Prevention and Health Promotion. National Diabetes Surveillance System: Prevalence of Diabetes. www.cdc.gov/diabetes/statistics/prev/national/tprevage.htm (accessed 23 August 2005).
4. Health Canada. Diabetes Among Aboriginal People in Canada: The Evidence. Ottawa: Health Canada; 2000. Table of Contents Full Text
5. Evers S, McCracken E, Antone I, et al. The prevalence of diabetes in Indians and Caucasians living in southwestern Ontario. Can J Public Health 1987;78:240-243. PubMed Citation
6. Pioro MP, Dyck RF, Gillis DC. Diabetes prevalence rates among First Nations adults on Saskatchewan reserves in 1990: Comparison by tribal grouping, geography and with non-First Nations people. Can J Public Health 1996;87:325-328. PubMed Abstract
7. Brassard P, Robinson E, Lavallee C. Prevalence of diabetes mellitus among the James Bay Cree of northern Quebec. CMAJ 1993;149:303-307. PubMed Abstract
8. Young TK, Szathmary EJE, Evers S, et al. Geographical distribution of diabetes among the native population of Canada: A national survey. Soc Sci Med 1990;31:129-139. PubMed Abstract
9. Johnson S, Martin D, Sarin C. Diabetes mellitus in the First Nations population of British Columbia, Canada: Part 3. Prevalence of diagnosed cases. Int J Circumpolar Health 2002;61:260-264. PubMed Abstract Full Text
10. Martin JD, Yidegiligne HM. Diabetes mellitus in the First Nations population of British Columbia, Canada. Int J Circumpolar Health 1998;57(suppl 1):335-339. PubMed Abstract
11. Harris SB, Gittlesohn J, Hanley A, et al. The prevalence of NIDDM and associated risk factors in native Canadians. Diabetes Care 1997;20:185-187. PubMed Abstract
12. Maberley DAL, King W, Cruess AF. The prevalence of diabetes in the Cree of Western James Bay. Chronic Diseases in Canada 2000;21:128-133. PubMed Abstract Full Text
13. Delisle HF, Ekoe J. Prevalence of non-insulin-dependent diabetes mellitus and impaired glucose tolerance in two Algonquin communities in Quebec. CMAJ 1993;148:41-46.
14. P.E.O.P.L.E. 27. BC Stats. BC Ministry of Management Services. P.O. Box 9410 Stn Prov Govt, Victoria, BC V8W 9V1.
15. British Columbia Vital Statistics Agency. 2001 British Columbia Census. Victoria, BC: Government of British Columbia; 2003.
16. Kennedy DID, Bouchard RT. Bella Coola Indians. In: Suttles W (ed). Handbook of North American Indians. Washington, DC: Smithsonian Institute; 1990:323-339.
17. McIlwraith TF. The Bella Coola Indians. Vol 1 and 2. Toronto: University of Toronto Press; 1992.
18. Thommasen HV. Prehistoric medicine on BC’s central coast. BCMJ 1999;41:343-346.
19. Acheson S. Culture, contact, demography and health among the aboriginal peoples of British Columbia. In: A Persistent Spirit: Towards Understanding Aboriginal Health in British Columbia. Stephenson PH, Elliott SJ, Foster LT, et al. (eds). Canadian Western Geographical Series. Volume 31. Victoria, BC: Western Geographical Press; 1995:1-42.
20. Thommasen HV, Newbery P, Watt WD. Medical history of central coast of British Columbia. BCMJ 1999;41:464-470.
21. Gobrial M, Mekael H, Anderson N, et al. Diabetic blood sugar control: An urban/rural comparison. BCMJ 2002;44:537-543. Abstract Full Text
22. Thommasen HV, Grzybowski S, Sun R. Physician:population ratios in British Columbia. Can J Rural Med 1999;4:139-145. Abstract Full Text
23. Thommasen HV, Berkowitz J, Grzybowski S. Community factors associated with long-term physician retention. BCMJ 2000;42:426-429. Full Text
24. Smylie J, and the Aboriginal Health Issues Committee. A guide for health professionals working with aboriginal peoples: Health issues affecting aboriginal peoples. J SOGC 2001;100:54-68. Full Text
25. Macaulay AC, Gibson N, Freeman W, et al. Participatory research maximizes community and lay involvement. BMJ 1999;319:774-778. PubMed Citation Full Text
26. Cave AJ, Ramsden VR. Hypothesis: The research page. Participatory action research. Can Fam Physician 2002;48:1671-1672. PubMed Citation Full Text
27. Ramsden VR. Hypothesis: The research page. Learning with the community: Evolution to transformative action research. Can Fam Physician. 2003;49:195-197. PubMed Citation Full Text
28. Boston P, Jordan S, MacNamara E, et al. Using participatory action research to understand the meanings aboriginal Canadians attribute to the rising incidence of diabetes. Chronic Dis Can 1997;18:5-12. PubMed Abstract Full Text
29. Meltzer S, Leiter L, Daneman D, et al. 1998 clinical practice guidelines for the management of diabetes in Canada. CMAJ 1998;159(suppl. 8):S1-S29. PubMed Abstract Full Text
30. Canadian Diabetes Association Clinical Practice Guidelines Expert Committee. Canadian Diabetes Association 2003 Clinical Practice Guidelines for the Prevention and Management of Diabetes in Canada. Can J Diabetes 2003;27(suppl 2):S1-S52. www.diabetes.ca/cpg2003/default.aspx (accessed 27 September 2004).
31. British Columbia Provincial Health Officer. The health and well-being of aboriginal people in British Columbia. In: A Report on the Health of British Columbians: Provincial Health Officer’s Annual Report 2001. Victoria, BC: Ministry of Health and Ministry Responsible for Seniors; 2002. Full Text
32. Edwards GW. Development of a native community health information system (NCHIS) for Indian and Inuit communities in Canada: A working resource for self-informed and self-determined primary health care and community development by Canadian First Nations. In: Building Partnerships in Community Health through Applied Technology. Proceedings of the 4th National and 2nd International Conference on Information Technology and Community Health. Scott L (ed). Victoria, BC: University of Victoria; 1992:33-40.
33. Michalos AC, Thommasen HV, Anderson N, et al. Determinants of health and the quality of life in the Bella Coola Valley. Social Indicators Research.
34. Hennekens CH, Buring JE. Epidemiology in Medicine. Philadelphia, PA: Lippincott Williams & Wilkins; 1987.
35. Snedecor GW, Cochran WG. Statistical Methods. 7th ed. Ames, IA: Iowa State University Press; 1980.
36. Young TK, Reading J, Elias B, et al. Type 2 diabetes mellitus in Canada’s First Nations: Status of an epidemic in progress. CMAJ 2000;163:561-566. PubMed Abstract Full Text
37. Young TK, Sevenhuysen GP, Ling N, et al. Determinants of plasma glucose level and diabetic status in a northern Canadian Indian population. CMAJ 1990;142:821-830. PubMed Abstract
Jana Patenaude, BSc, MSc, Hugh Tildesley, MD, CM, FRCPC, Amy MacArthur, MHSc, Donald C. Voaklander, PhD, Harvey V. Thommasen, MD, CCFP, FCFP
Ms Patenaude is with the Community Health Program at the University of Northern British Columbia, Prince George, BC. Dr Tildesley is clinical associate professor in the Department of Medicine, University of British Columbia, and director of the Diabetes Teaching and Training Centre, St. Paul’s Hospital, Vancouver, BC. Ms MacArthur was a statistician with the Department of Family Practice, Faculty of Medicine, UBC. Dr Voaklander is with the BC Rural and Remote Health Research Institute, UBC. Dr Thommasen is associate clinical professor in the Faculty of Medicine, UBC, and adjunct professor in the Community Health Program, UNBC.